
Low-Cost Digital Side Hustles: Practical Ways to Start in 2026
Explore low cost digital side hustles you can test in 2026. Compare freelance work, digital goods, and reselling while managing hidden platform fees and time.
October 13, 202618 min read

In July 2026, 22.2% of U.S. workers teleworked or worked from home for pay, according to the Bureau of Labor Statistics. That figure includes people who worked entirely from home and those who did so for only some hours. It’s a useful snapshot, but it won’t match every headline about remote work, because surveys often measure different groups and work arrangements.
When remote-work statistics seem to conflict, the difference may come down to definitions rather than data quality. The BLS counts workers across the economy, while Gallup and WFH Research report on narrower groups or distinguish fully remote, hybrid, and on-site schedules. Survey dates matter, too. A monthly estimate and a survey covering arrangements over a year aren’t direct substitutes.
This guide explains what remote work statistics 2026 measure, how the main indicators compare, and what conclusions the evidence can reasonably support. You’ll see which populations each figure describes, how work-from-home rates differ from remote and hybrid shares, and where the data has limits. That context can help you assess remote job availability and make informed career or workplace decisions without reading more certainty into a percentage than it can provide.
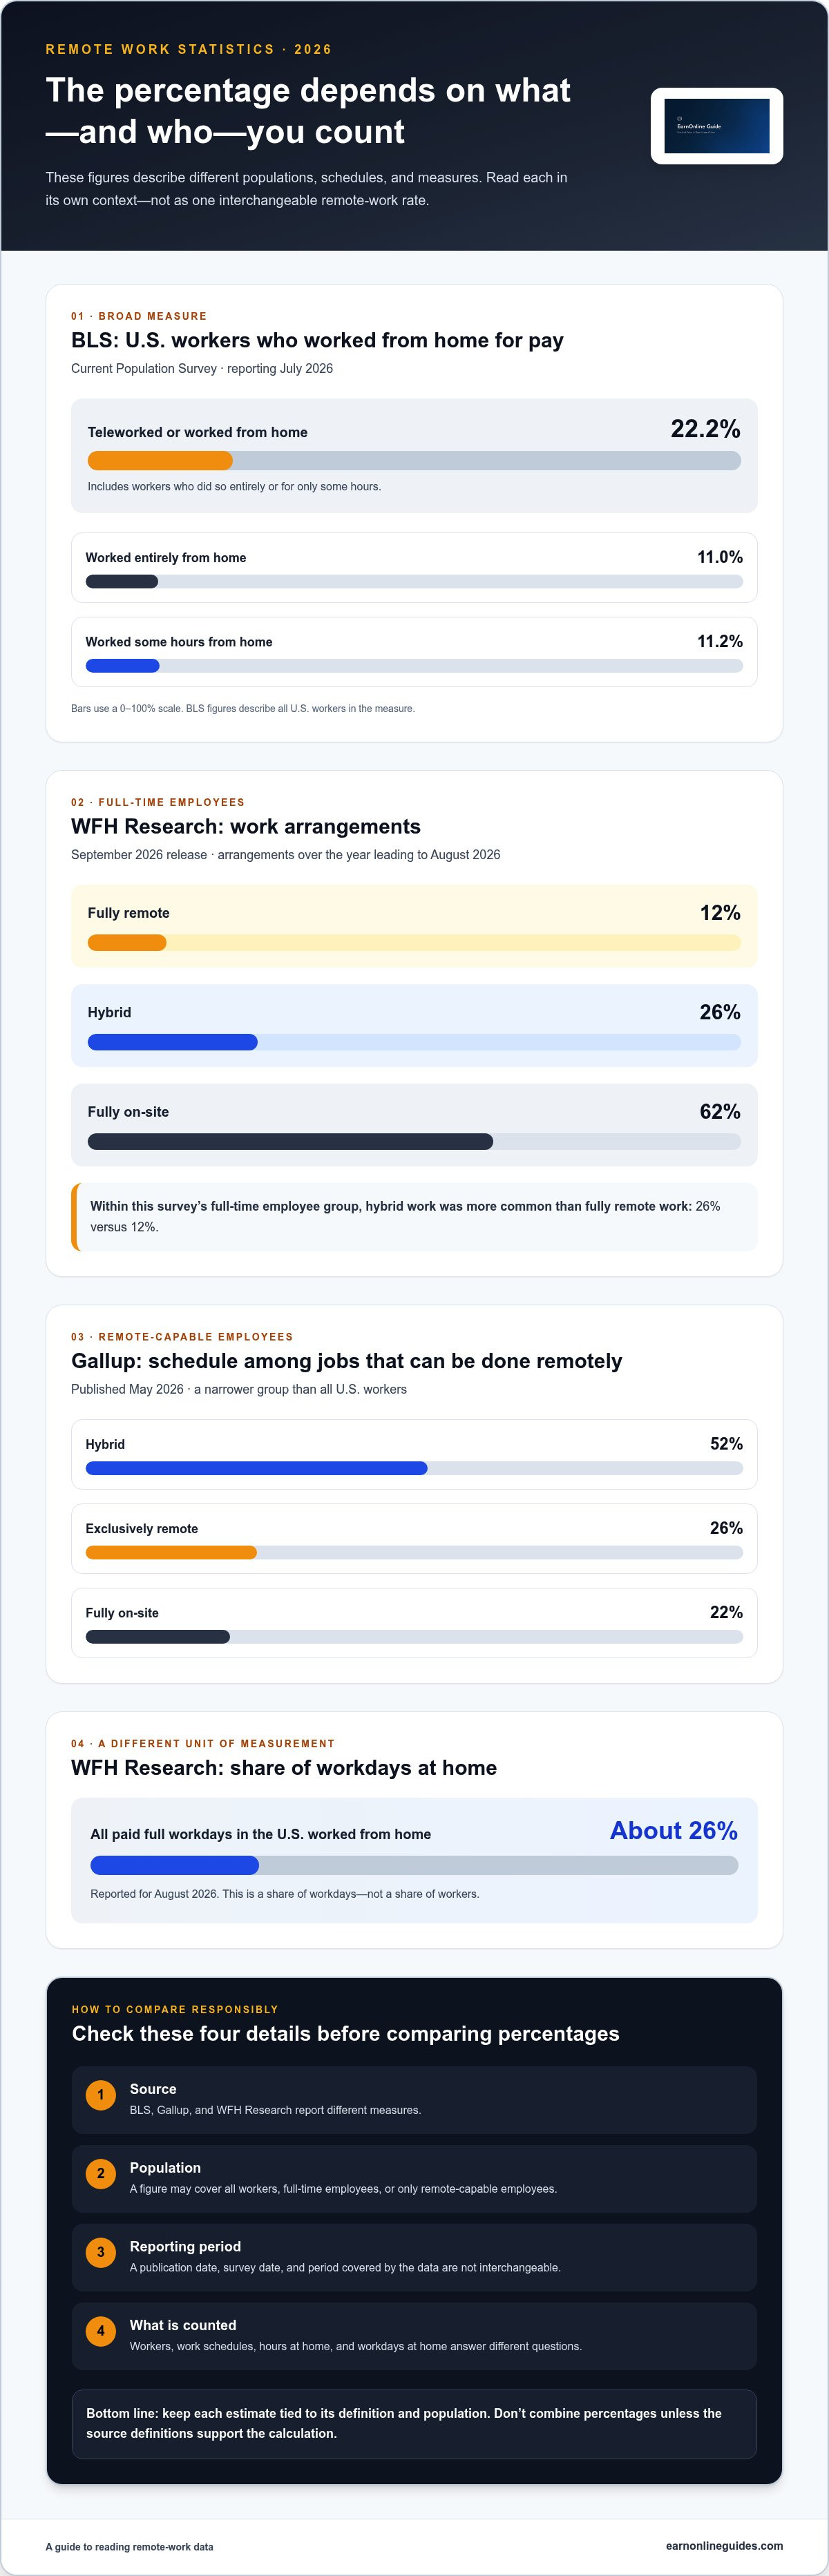
Remote work statistics 2026 describe different slices of U.S. work, not one universal remote-work rate. Gallup reported in May 2026 that, among employees whose jobs can be done remotely, 52% worked hybrid, 26% exclusively remote, and 22% fully on-site. WFH Research’s September 2026 release reported work arrangements among full-time U.S. employees over the year leading to August: 12% fully remote, 26% hybrid, and 62% fully on-site. These results describe different populations: Gallup focuses on remote-capable employees, while WFH Research reports on full-time employees.
Remote work statistics measure where and how often people work, but their meaning depends on the source’s definitions and the population counted. “Remote work” is a broad term for working away from a central workplace, often from home. “Hybrid” means combining remote and on-site work. “Work from home” identifies the work location, which may be occasional or regular. “Telework” is used in some surveys for work performed from home, but the specific measure can vary. The Remote work overview provides broader context on the terminology.
A statistic may count people who work from home at least sometimes, people who work there exclusively, or the share of workdays completed at home. For example, the BLS reported that 22.2% of U.S. workers teleworked or worked from home for pay in July 2026, including workers who did so entirely or for only some hours. That measure is not the same as Gallup’s separate categories of hybrid, exclusively remote, and fully on-site employees. Don’t combine categories unless the source’s definitions support the calculation.
Check four details before comparing figures: the source, population, data-collection or reporting period, and exactly what the measure counts. “2026” might identify when a report was published, when a survey was conducted, or the period covered by the data. Those dates aren’t interchangeable. Also distinguish observed survey results from forecasts, worker preferences, or platform-specific job counts. Each answers a different question. If a report doesn’t clearly explain its sample or method, treat its estimate cautiously rather than assuming precision.
The site’s remote work statistics resource is a starting point for comparing measures. Match definitions and populations before drawing conclusions about who can work remotely and who actually does.
There isn’t one percentage that captures every form of remote work. The figures below come from different sources and measure different populations, schedules, and units. Read each row on its own terms rather than combining rates that describe different things.
| Source and release | Population and measure | Reported figure |
|---|---|---|
| U.S. Bureau of Labor Statistics (BLS), Current Population Survey; published September 2026, reporting July 2026 | U.S. workers who teleworked or worked from home for pay | 22.2% overall |
| BLS, same release and reporting period | U.S. workers who worked entirely from home | 11.0% |
| BLS, same release and reporting period | U.S. workers who worked some hours from home | 11.2% |
| WFH Research, Survey of Working Arrangements and Attitudes; published September 2026, covering the year leading to August 2026 | Full-time U.S. employees, fully remote arrangement | 12% |
| WFH Research, same release and reporting period | Full-time U.S. employees, hybrid arrangement | 26% |
| Gallup; published May 2026, reporting arrangements among employees whose jobs can be done remotely | Remote-capable U.S. employees, hybrid arrangement | 52% |
| WFH Research; published September 2026, reporting August 2026 | All paid full workdays in the U.S. worked from home | About 26% |
Among full-time U.S. employees, WFH Research reported that hybrid work was more common than fully remote work over the year leading to August 2026, at 26% versus 12%. This comparison applies to one source and population, not to all U.S. workers.
The BLS Current Population Survey provides a broad measure of workers who teleworked or worked from home for pay. The BLS American Time Use Survey offers a separate perspective on time spent working at home. Its results shouldn’t be substituted for the monthly CPS measure. Gallup’s figure applies only to employees whose jobs can be done remotely. Each source can help answer a different question, as long as you keep its population and measure in view.
A national figure doesn’t describe every occupation or employer. Jobs that require in-person service or equipment may have fewer remote options than work that can be performed online. These estimates measure actual arrangements, not employee preferences or employer policies. For job research, use the figures as context, then examine the schedule and location requirements of specific roles. The complete guide to remote work offers a next step for exploring those practical considerations.
Different percentages don’t automatically mean a source is wrong. They may reflect differences in the populations surveyed, definitions, questions, or reporting periods. Before treating two figures as contradictory, check what each one counts and whether both answer the same question.
A survey of all workers includes jobs that generally require an in-person presence, while a survey of remote-capable employees focuses on work that can be done away from the workplace. The resulting percentages describe different groups. A measure of workdays at home also differs from a measure of employees with a hybrid or fully remote arrangement.
Question wording matters, too. A survey might ask about a person’s usual schedule, a specific recent workweek, or whether they worked from home at all during a reference period. Those answers aren’t interchangeable. Check the original documentation for the sampled population, exclusions, response rate, and question wording. If the report doesn’t provide those details, don’t assume them or imply more precision than the source supports.
A report published in 2026 may describe data gathered in 2025, a particular month in 2026, or work arrangements over a longer period. Record the collection or reporting period separately from the publication date. For instance, the Bureau of Labor Statistics’ American Time Use Survey reports on time-use data for a stated reference year, so a 2026 release shouldn’t automatically be described as measuring 2026 behavior.
This distinction matters when comparing trends. Two figures collected at different times and with different methods can’t, by themselves, establish that remote work rose or fell. If the latest available observation is from a prior year, label it that way rather than presenting it as a 2026 measurement.
Observed arrangements show what respondents report doing. Preference surveys ask what they would choose, while employer-policy surveys describe rules or intentions. Forecasts estimate what may happen later. Each measure can be useful, but they shouldn’t be combined as if they describe the same outcome.
For example, Gallup’s November 2025 survey found that 61% of remote-capable employees preferred hybrid work. That is evidence about stated preference, not the share actually working hybrid. A job platform’s listing count is different again: it reflects activity on that platform, not the proportion of U.S. workers in remote jobs.
When comparing remote work statistics 2026, match the source, population, definition, question, and data period. If one of those is unclear, treat the comparison as uncertain rather than forcing a single national conclusion.
The 2026 figures describe how groups of workers report working, not whether a particular person will get a remote job. They can help job seekers understand that hybrid arrangements are common among remote-capable employees, and help employers compare their policies with broad patterns. They can’t predict an individual hiring decision or show whether a specific role will remain remote.
Availability also isn’t the same as satisfaction, productivity, or health. Gallup’s 2026 workplace report found that 45% of both fully remote and hybrid workers reported “thriving” in life satisfaction, compared with 32% of on-site remote-capable workers. That is a self-reported well-being measure, not proof that work location alone caused the difference. Separately, a randomized trial published by Bloom and coauthors in Nature in 2024 found that a hybrid model did not negatively affect performance or promotions over two years and reduced employee attrition by 33%. One study does not establish the same outcome for every employer or occupation.
A job may be technically remote-capable without an employer actively hiring for it. Vacancies and hiring decisions change, and a job-board count describes listings on that service, not the odds that any applicant will be hired. National prevalence figures also can’t tell you whether a role matches your skills, experience, or location requirements.
Use the data as context, then review the duties, qualifications, and schedule in individual postings. To explore roles, browse legitimate remote job listings. Listings can help you investigate opportunities, but they don’t promise placement or employment.
Remote-work prevalence alone doesn’t show whether remote jobs pay more or less. Compensation depends on the role and its terms, so compare salary information for specific occupations rather than inferring a pay advantage from where people work. The guide to work-from-home career paths and pay covers that question separately.
Likewise, a preference survey describes what respondents say they want, not necessarily the schedule they have. For a broader discussion of workplace changes, see this guide to remote-work trends. Remote work statistics 2026 are most useful as labor-market context; individual openings, employer policies, and job-specific evidence matter for personal decisions.
Use remote-work data to frame questions, then test those questions against the roles you’re considering. A national percentage can show that remote or hybrid work exists across the labor market, but it can’t tell you whether a particular employer is hiring, what skills a role requires, or whether you’ll be selected.
Once you understand what a statistic measures, narrow your research to the occupation and skills that fit your goals. Review actual postings for duties, required qualifications, location limits, and whether “remote” means fully remote or a hybrid schedule. Those details are more useful for evaluating an individual opportunity than a national average.
For broader career context beyond the data, read the complete guide to remote work. It connects labor-market patterns with practical considerations as you assess remote roles.
Remote work statistics 2026 are a starting point for informed research, not a personal prediction. To explore specific openings, browse legitimate remote job listings and compare each role’s requirements and schedule.
The main lesson from remote work statistics 2026 is that a percentage only makes sense alongside its source, population, definition, and reporting period. National averages offer useful labor-market context, but they can’t predict whether you’ll be hired for a specific role. Hybrid, fully remote, and work-from-home measures also answer different questions.
For career planning, use the figures to shape your research, then compare actual openings by occupation, required skills, and schedule. If you need broader context on remote work, the complete remote-work guide explores related career considerations.
When you’re ready to explore specific opportunities, browse legitimate remote job listings and use the remote work statistics resource to put labor-market figures in context. Review each role’s requirements and schedule as you decide what to pursue.
In July 2026, 22.2% of U.S. workers teleworked or worked from home for pay, according to the Bureau of Labor Statistics’ Current Population Survey, published in September 2026. This measure includes fully and partially home-based work: 11.0% worked entirely from home, while 11.2% worked some hours from home. It is not a fully remote rate, and it covers workers across the U.S., not only remote-capable employees.
No. Sources use these terms in different ways. A work-from-home measure may count anyone who worked at home during a specified period, including hybrid workers or people who did so occasionally. Other measures report exclusively remote arrangements, hybrid schedules, or only employees whose jobs can be done remotely. Before comparing percentages, check each source’s definition and population. Differently defined groups shouldn’t be treated as equivalent.
Estimates can differ because studies survey different populations, use different question wording, collect responses at different times, or apply different sampling methods. Some ask about a usual schedule; others ask about work during a specific recent period. For a fair comparison, check the original methodology and match the population, work arrangement, and data period. Different results don’t automatically mean one source is inaccurate.
The available Bureau of Labor Statistics Current Population Survey figures suggest the share of U.S. workers teleworking or working from home has remained broadly stable, around 22% to 24% since early 2024. The July 2026 estimate was 22.2%. This describes reported behavior, not employee preferences or employer plans. The pattern doesn’t establish what will happen next, and comparisons should use the same measure and population over time.
No. Workforce statistics describe reported work arrangements, not a list of active vacancies. Whether a specific job is remote depends on its duties, the employer’s policy, and hiring needs. Job listings are more useful for researching openings, though they don’t show the likelihood of being hired. Explore legitimate remote job listings and review each posting’s requirements and schedule.
No. National statistics describe patterns across groups and can’t predict an individual hiring outcome. Your prospects depend on factors such as role fit, qualifications, employer needs, and the applicant pool. Use remote work statistics 2026 as background for focused research, then assess actual openings and their requirements. A national average is useful context, not a guarantee or personalized forecast of your job search.

Article by
EarnOnlineGuides Editorial Team
The EarnOnlineGuides Editorial Team creates practical, research-driven educational content about making money online, remote work, freelancing, side hustles, digital skills, AI tools, online business, and self-employment. Our goal is to help readers understand their options, compare realistic opportunities, avoid misleading claims, and make better-informed decisions. We prioritize accuracy, transparency, practical guidance, and responsible reporting, and we regularly review our content to keep it useful and up to date.
The information provided in this article is for general educational and informational purposes only and should not be considered financial, investment, tax, legal, or professional advice. Earnings, income examples, costs, fees, and other figures may vary and are not guaranteed. Always conduct your own research and consult a qualified professional when appropriate.
Some articles on EarnOnlineGuides may contain affiliate links. If you click a link and make a purchase or sign up for a service, we may receive a commission at no additional cost to you. This does not influence our editorial standards or recommendations.
We strive to keep our information accurate and up to date, but products, services, fees, policies, laws, and market conditions can change. Please verify important information directly with the relevant provider before making financial or business decisions.
Educational information only. This article is not financial, tax, or legal advice. Platform fees and policies change; always confirm current rates in the marketplace's official fee documentation before making decisions.
Explore low cost digital side hustles you can test in 2026. Compare freelance work, digital goods, and reselling while managing hidden platform fees and time.

Learn how to open a freelance business bank account step by step. Explore document checklists, compare bank options, and keep business finances organized.

Learn how to write affiliate product reviews readers can trust. Discover a practical process for honest testing, balanced pros and cons, and clear disclosures.